New Pinterest Analytics Dashboard Provides Valuable Insights
Lauren Peek | @_LaurenPeek As social media business accounts have exploded in number, the need for better and more accurate analytics has risen also. Pinterest has recently rolled out a new, extensive dashboard providing much more insight into the demographics and interest of audience members as well as the performance of pins.
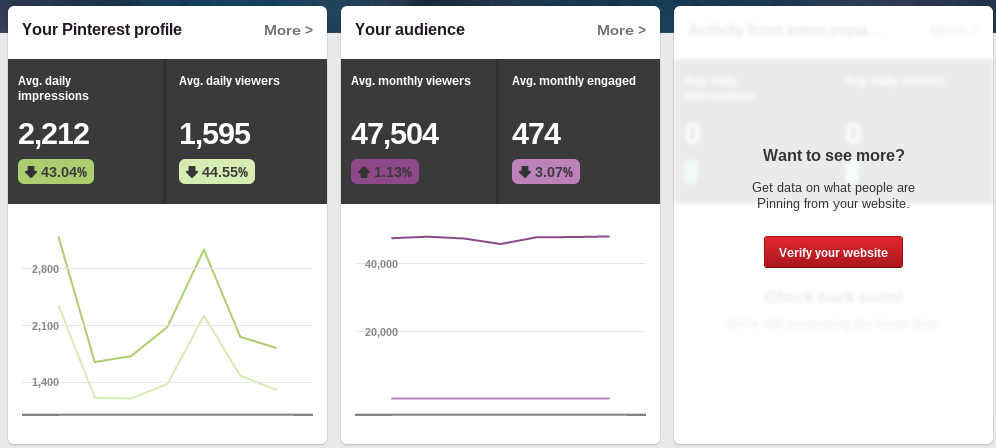
Originally, Pinterest analytics only showed analytics from the “Pin It” button. The new analytics dashboard has three sections: Your Pinterest Profile, Your Audience and Activity From (Your Website), should you choose to connect them.
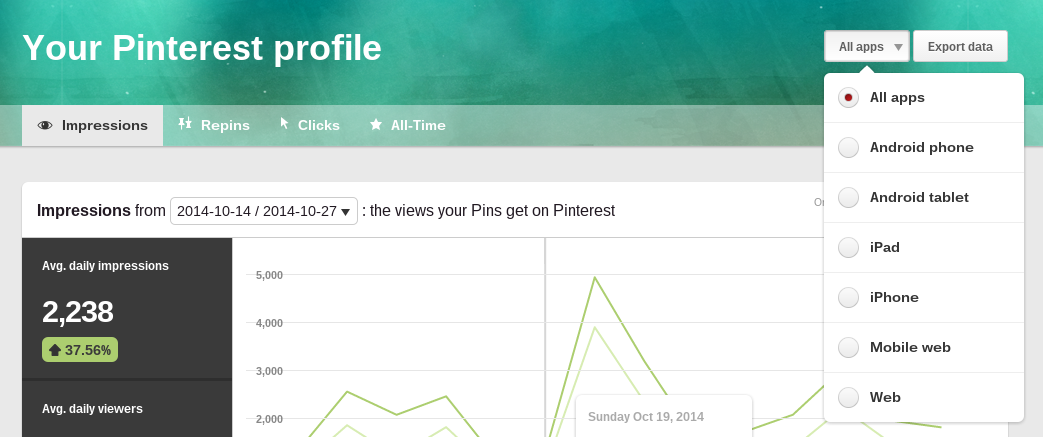
Under “Your Pinterest Profile,” analytics are broken down into four sections: impressions, repins, clicks and all-time.
Under impressions, you can see impressions and average daily viewers as well as the increase or decrease compared to the past time period (which you can adjust). Engagement can be broken down by boards, impressions, clicks, repins and likes. Pinterest will also show you which of your boards get the most impressions, clicks, repins, likes and number of pins.
The repins section will tell you the average daily repins and repinners over a length of time as well as the change over time. You will also see which of your pins have been repinned the most over the past 30 days and which of your boards get the most repinning activity.
Clicks will show average daily clicks and average daily visitors as well as the change from the last period. You will also see your most clicked pins over the last 30 days and boards with the most clicked pins over the last 30 days.
In the all-time section, you will see your 50 most shared pins, your pins that rank higher in search on Pinterest, and your power pins that have a high mix of repins, clicks, impressions, etc.
Under “Your Audience,” there are two sections: demographics and interests. In this section, data can be broken down by Your Followers and All Audiences, meaning all of Pinterest. Demographics will show you average monthly visitors, the change from the past month, average monthly engagement and the variation from the past month.
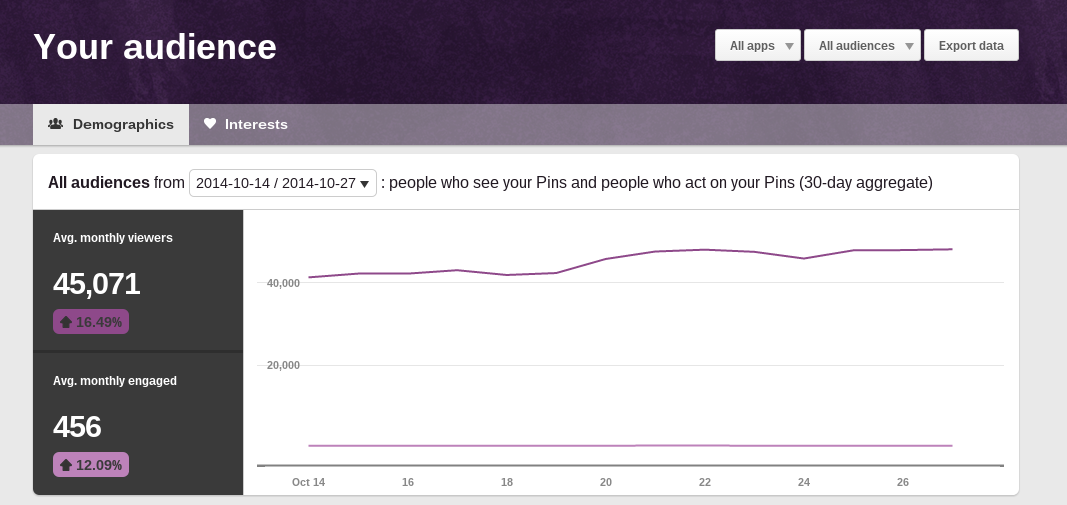
Under Demographics you can also see which countries your audience members and followers live in, the languages they speak, the metropolitan areas they live in and their gender break down.
Interests will show you what topics you audience and followers are interested in, audience boards with lots of your pins and other businesses your audiences interact with.
If you verify your website with Pinterest, you can see your website’s top 50 pins and 20 top boards in addition to those pin's impressions, repins and clicks. Original pins will show you the 50 newest pins from your website. The all-time tab will show you the top performing 50 pins from your website over all.
All of these categories allow you to export this data to a spreadsheet and therefore create your own reports. Data can be broken down by apps (android phone, android tablet, iPad, iPhone, mobile web, web), allowing you to see where your followers and audience members are viewing your pins.
The plethora of information now available via Pinterest analytics allows businesses to see valuable information about their followers, followers' interests and how their pins are stacking up. Social media companies and users can now see which pins perform better among their own followers as well as how their pins perform in search across the entire platform. With this data in hand, the content creation process can be adjusted to the interests of the audience so that pins will perform better over time.